Gather Performance Data for Your Application
The Application-OS Profiler is an add-on to the established AppCOE Eclipse based code migration and API optimization technology and is designed to enable data collection, identify performance bottlenecks and compare performance metrics on various target environments.
Application-OS Profiler
- There are two types of Profilers
- Application Platform Profiler
- Application Profiler
Application Platform Profiler
- Application Platform Profiler enables you to generate a Timing report and view a performance report of your Application for all the Supported Interfaces by MapuSoft.
- It will generate a detailed Performance report of all the Platform API's and the Application Functions used.
- Platform API's Profiling is available for MapuSoft Interfaces only not available for profiling Native OS.
Application Profiler
- Application Profiler enables you to generate a Timing report and view a performance report of all the Functions used in the Application.
- Users can also Profile their Application on the Target hardware and collect the performance report for all the Native OS Functions.
- Using the Native OS Functions you can get the timing report of all the Application Functions used. But if you use Mapusoft Interface API's instead of Native OS API's you can also get the advantage of generating the Platform API's timing in the report.
Supported Interfaces









Advantages of Application-OS Profiler
- Application-OS Profiler enables you to generate Timing Comparison Reports. This feature compares two timing reports and compares the performance for API’s at different times and different values.
- These reports help in performance impact analysis by detailing specific API execution times during a particular time-period as well as the average and total API execution times.
- It enables you to collect data pertaining to MapuSoft API‘s (Platform API Profiling) and profile user specific functions (Application Profiling).
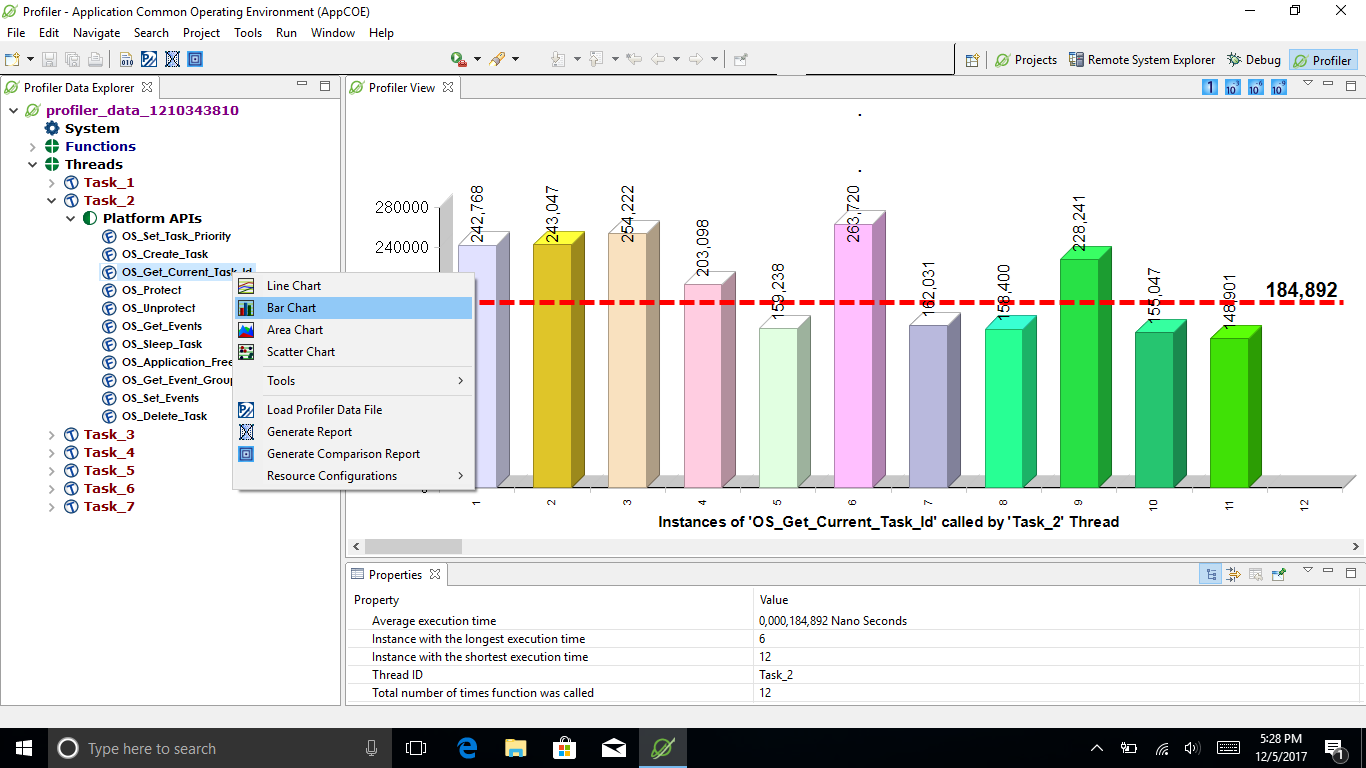
- Users can analyze the data with the Application-OS Profiler graphical viewer which offers area, bar, line, pie, and scatter charts, as shown in Figure 1.
- The data collected by the profiler provides feedback concerning the utilization of MapuSoft‘s APIs in the project.
Figure 1: Application-OS Profiler
Tell Us About Your Requirement
Start A Free 30 Day Product Trial
Working with leaders in every industry
In the past 2 decades, MapuSoft has delivered valuable solutions to almost every industryExplore Products
AppCOE
OS Changer
Automated Code Changer
Supported OS and Hardware types
Try or Buy
Trial Software
Contact Sales
Installation Help
Get Support
Support Portal
FAQ
Technical Data
Company
Career
News Room
Contact Us
Customers
Partners


