
Components on the Application-OS Profiler Window
The Application-OS Profiler window contains two panes. The left pane lists the three Profiler components and in the right pane shows the respective details/values or information in a graphical view.
The three main components of Application-OS Profiler are:
1. System:
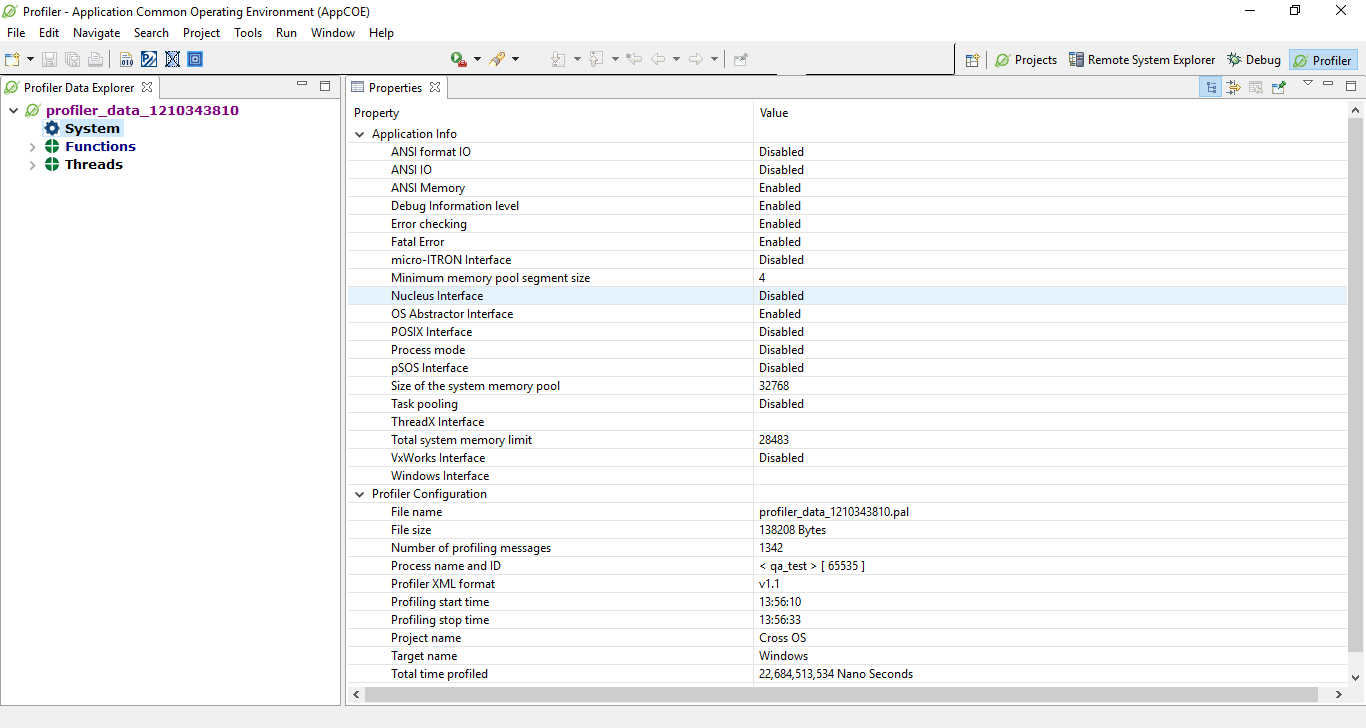
This displays the system details of your application as shown in Figure 1. If you select the System tab, the following details are displayed on the right pane along with their values.
- Application Info – Application property values
- Profiler Configuration – Profiling Application values
Figure 1: Application-OS Profiler – System Details
2. Functions:
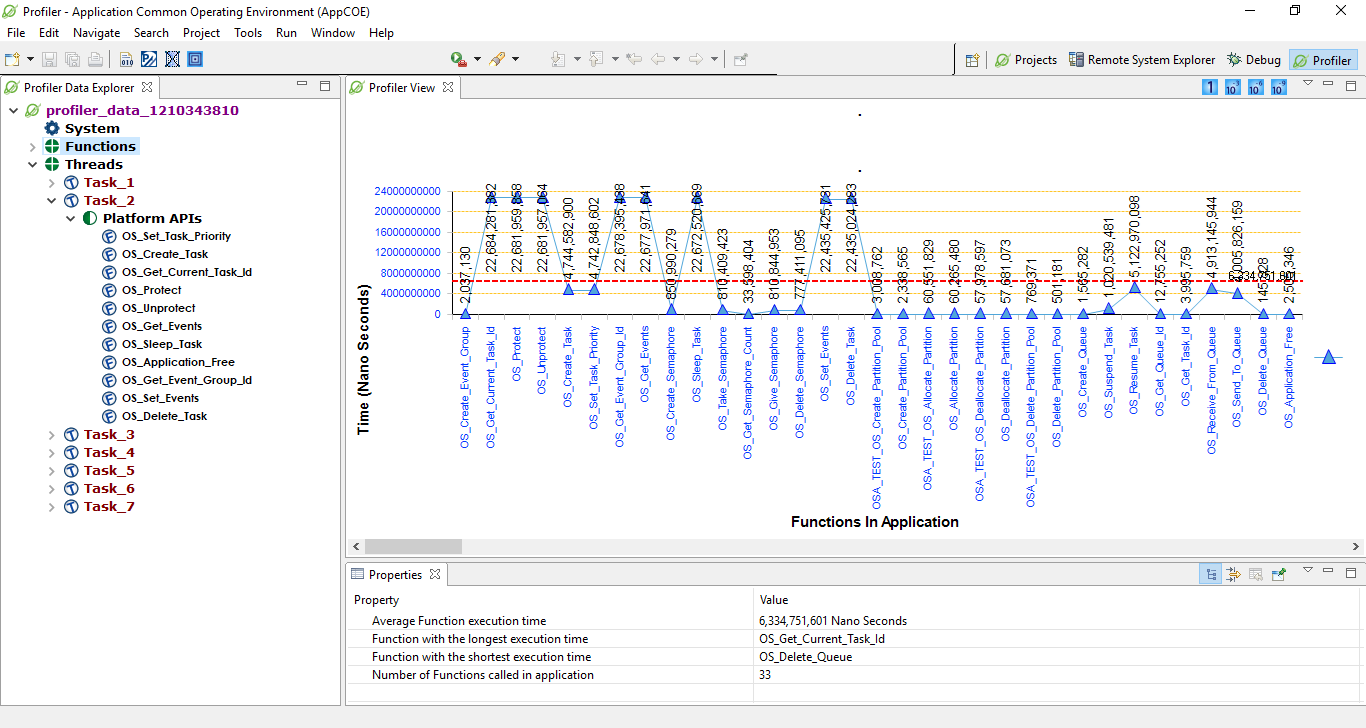
This displays all the functions called in the application and the time taken to execute these functions as shown in Figure 2. The following Function properties are displayed in the bottom window:
• Average Function execution time
• Function with the longest execution time
• Function with the shortest execution time
• Number of Functions called in application
Figure 2: Application-OS Profiler Functions
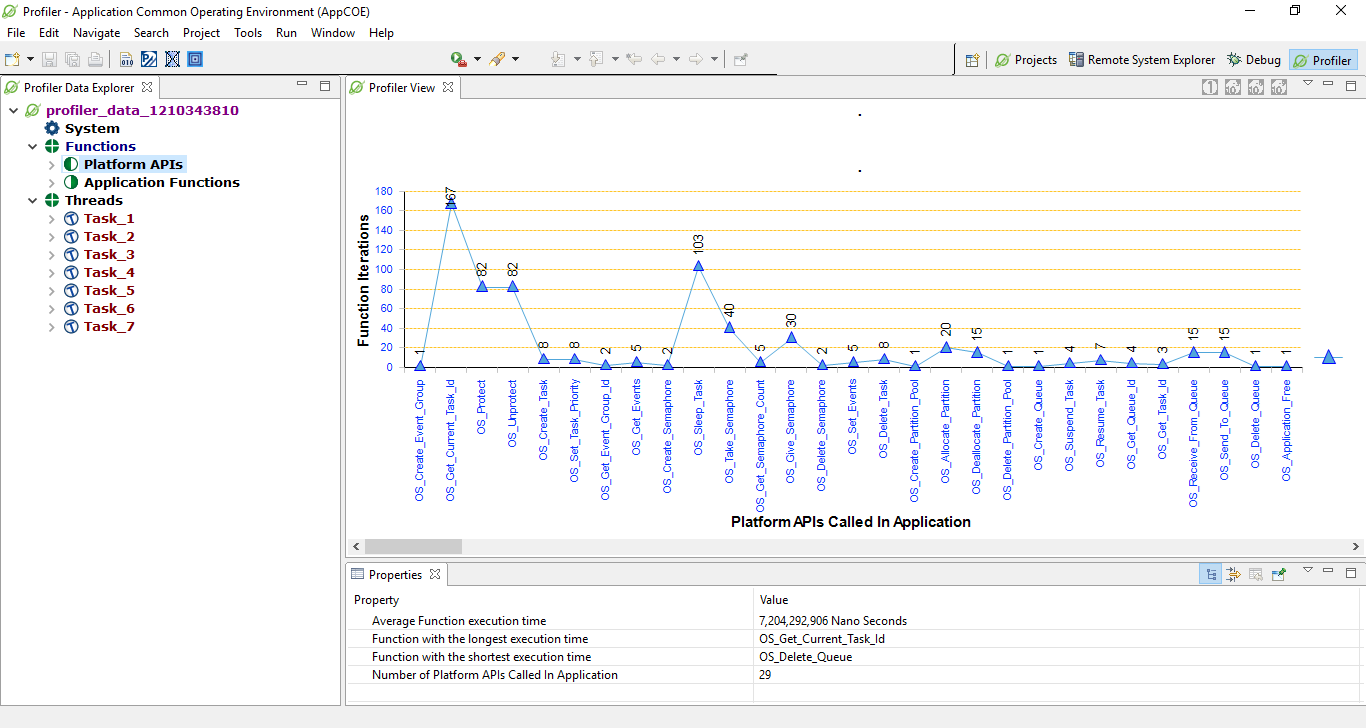
Expanding the Functions tab in the left pane, displays the following information as shown in Figure 3.
- Platform APIs
- Application Functions
Platform APIs
These are all the OS Abstractor Interface functions called in the application. On the x-axis, all the functions are displayed. On the y-axis, all Functions iterations are displayed. Function properties are displayed in the bottom window:
- Average Function execution time
- Function with the longest execution time
- Function with the shortest execution time
- Number of OS Abstractor Interface Functions called in application
Figure 3: Platform APIs and Application Functions
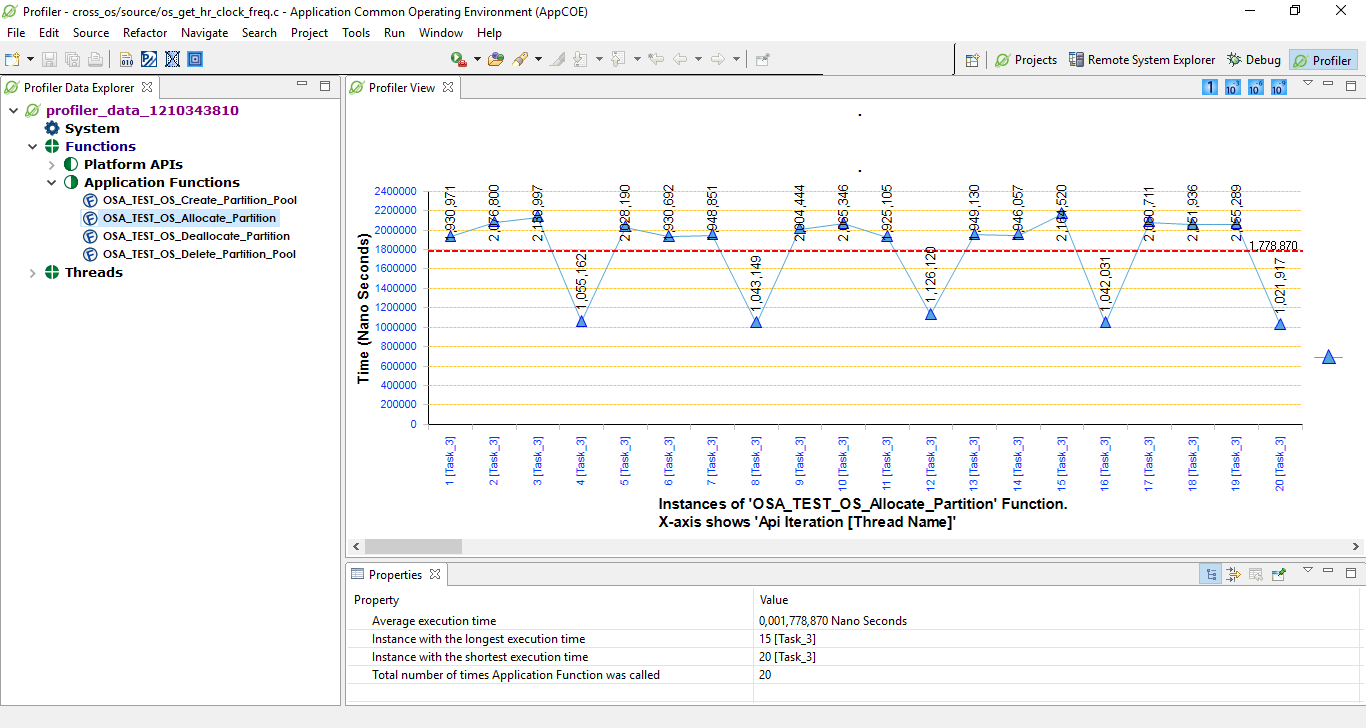
If you expand the Platform APIs, you can view all the platform APIs called in the application as shown in Figure 4. Function properties are displayed in the bottom window:
- Average execution time
- Instance with the longest execution time The Task _1in square brackets denote that these function properties belong to the Task 1 Thread.
- Instance with the shortest execution time
- Total number of times function was called
Figure 4: Application – Functions
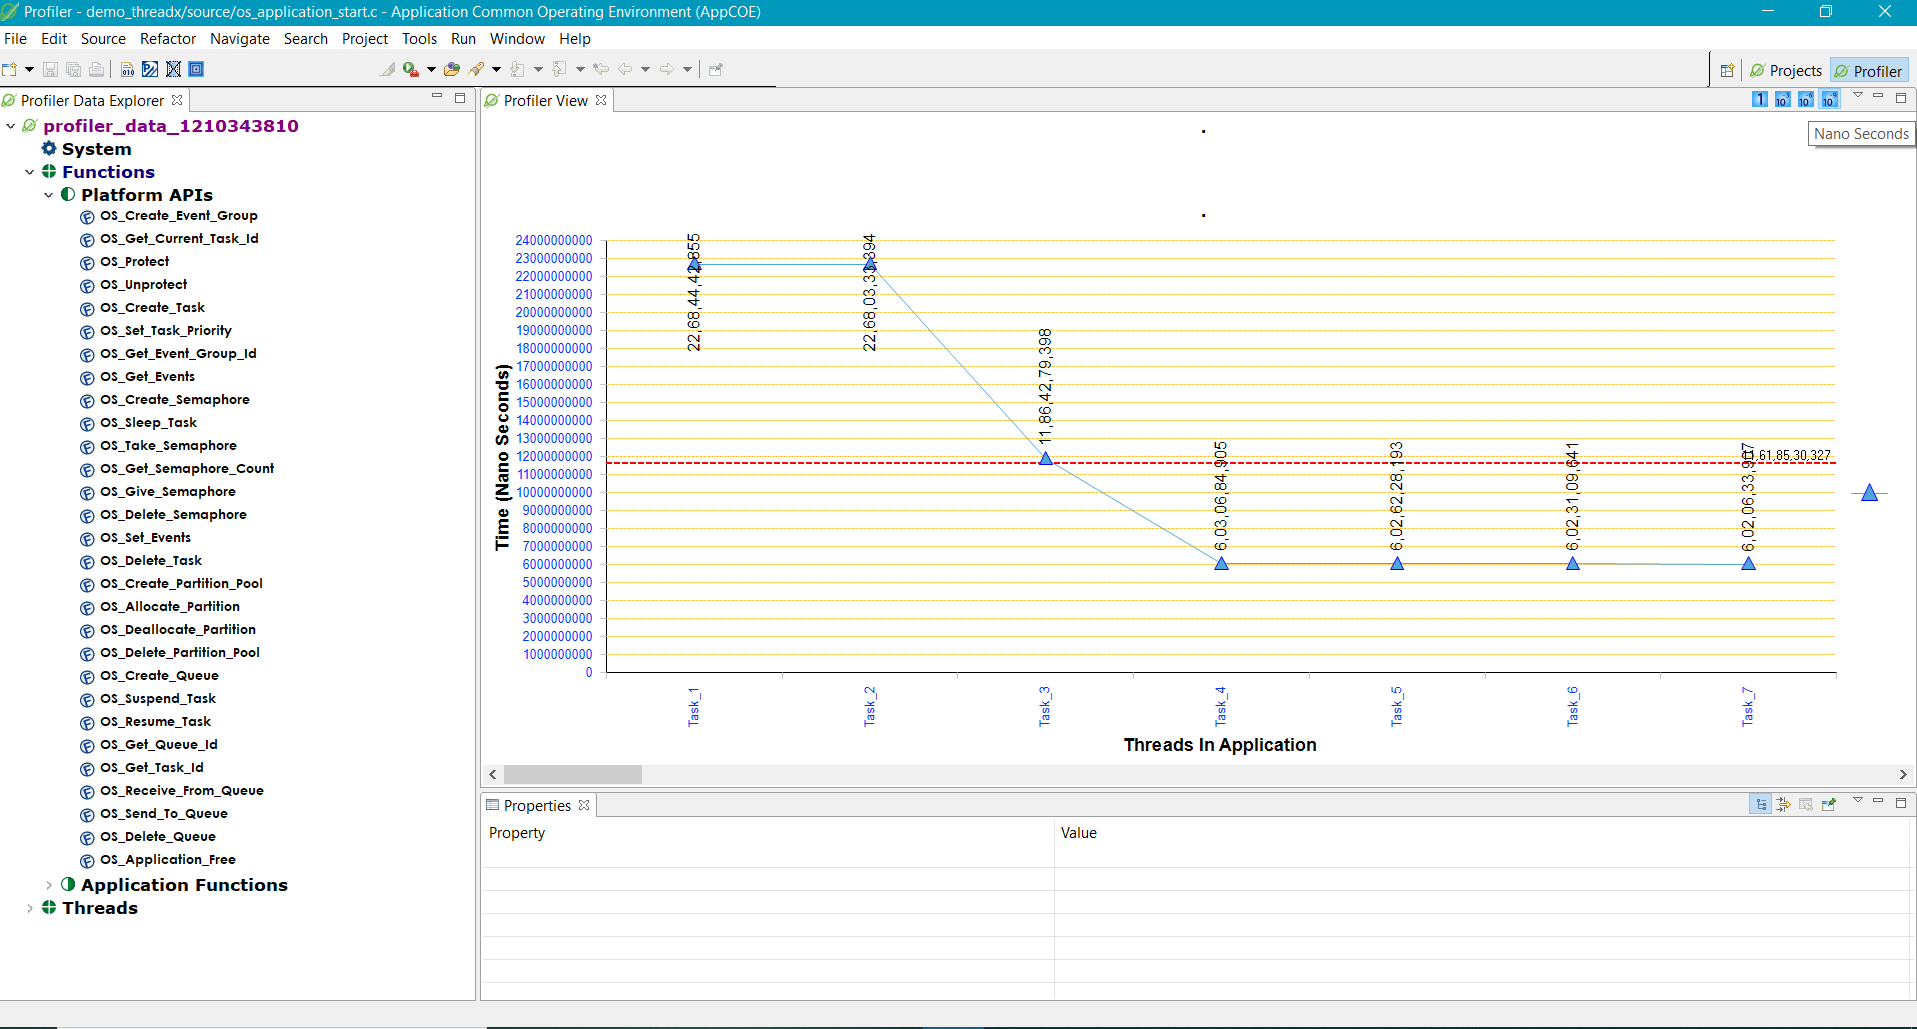
If you click on a Platform API, you can view the number of instances of the specific function on the x-axis and the time taken for each API on the y-axis.
On the top-right of the profiler view, you can see different measures of time:
- Seconds
- milli seconds
- micro seconds
- nano seconds as highlighted in the Figure 4
This is used to capture the time taken for each instance of the function in different time measures. If you click on nano seconds, the time graph will be shown as Time (nano seconds).
Application Functions:
These are all the user specific functions called in the application. On the x-axis, all the user specific functions are displayed. On the y-axis, all functions iterations are displayed. Function properties are displayed in the bottom window:
- Average Function execution time
- Function with the longest execution time
- Function with the shortest execution time
- Number of times Application Functions are called in application
Figure 5: Application – Functions
3. Threads
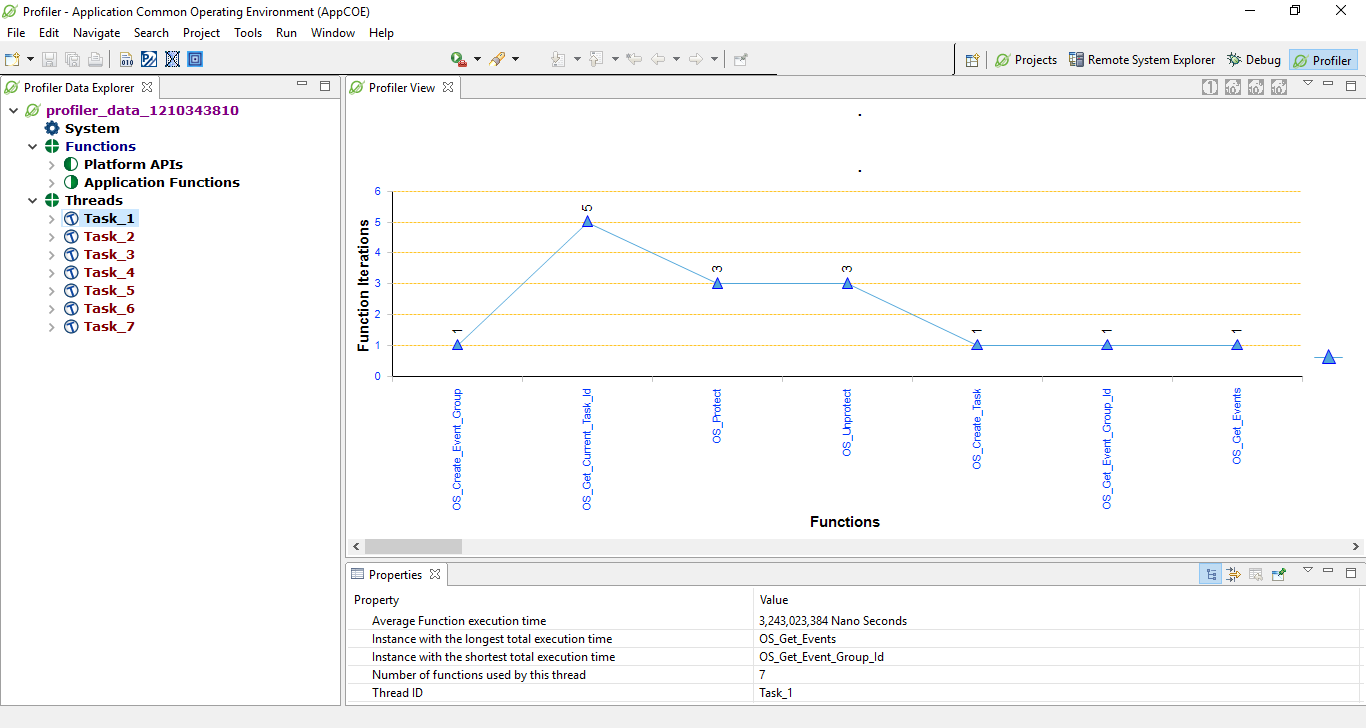
Threads are created to execute any function in an application. Application-OS Profiler allows you to view the Thread properties by expanding the Thread tab as shown in Figure 6. Thread properties are displayed in the bottom window:
- Average Function execution time
- Instance with the longest total execution time
- Instance with the shortest total execution time
- Number of Functions used by this thread
- Thread ID
Figure 6: Application-OS Profiler – Threads
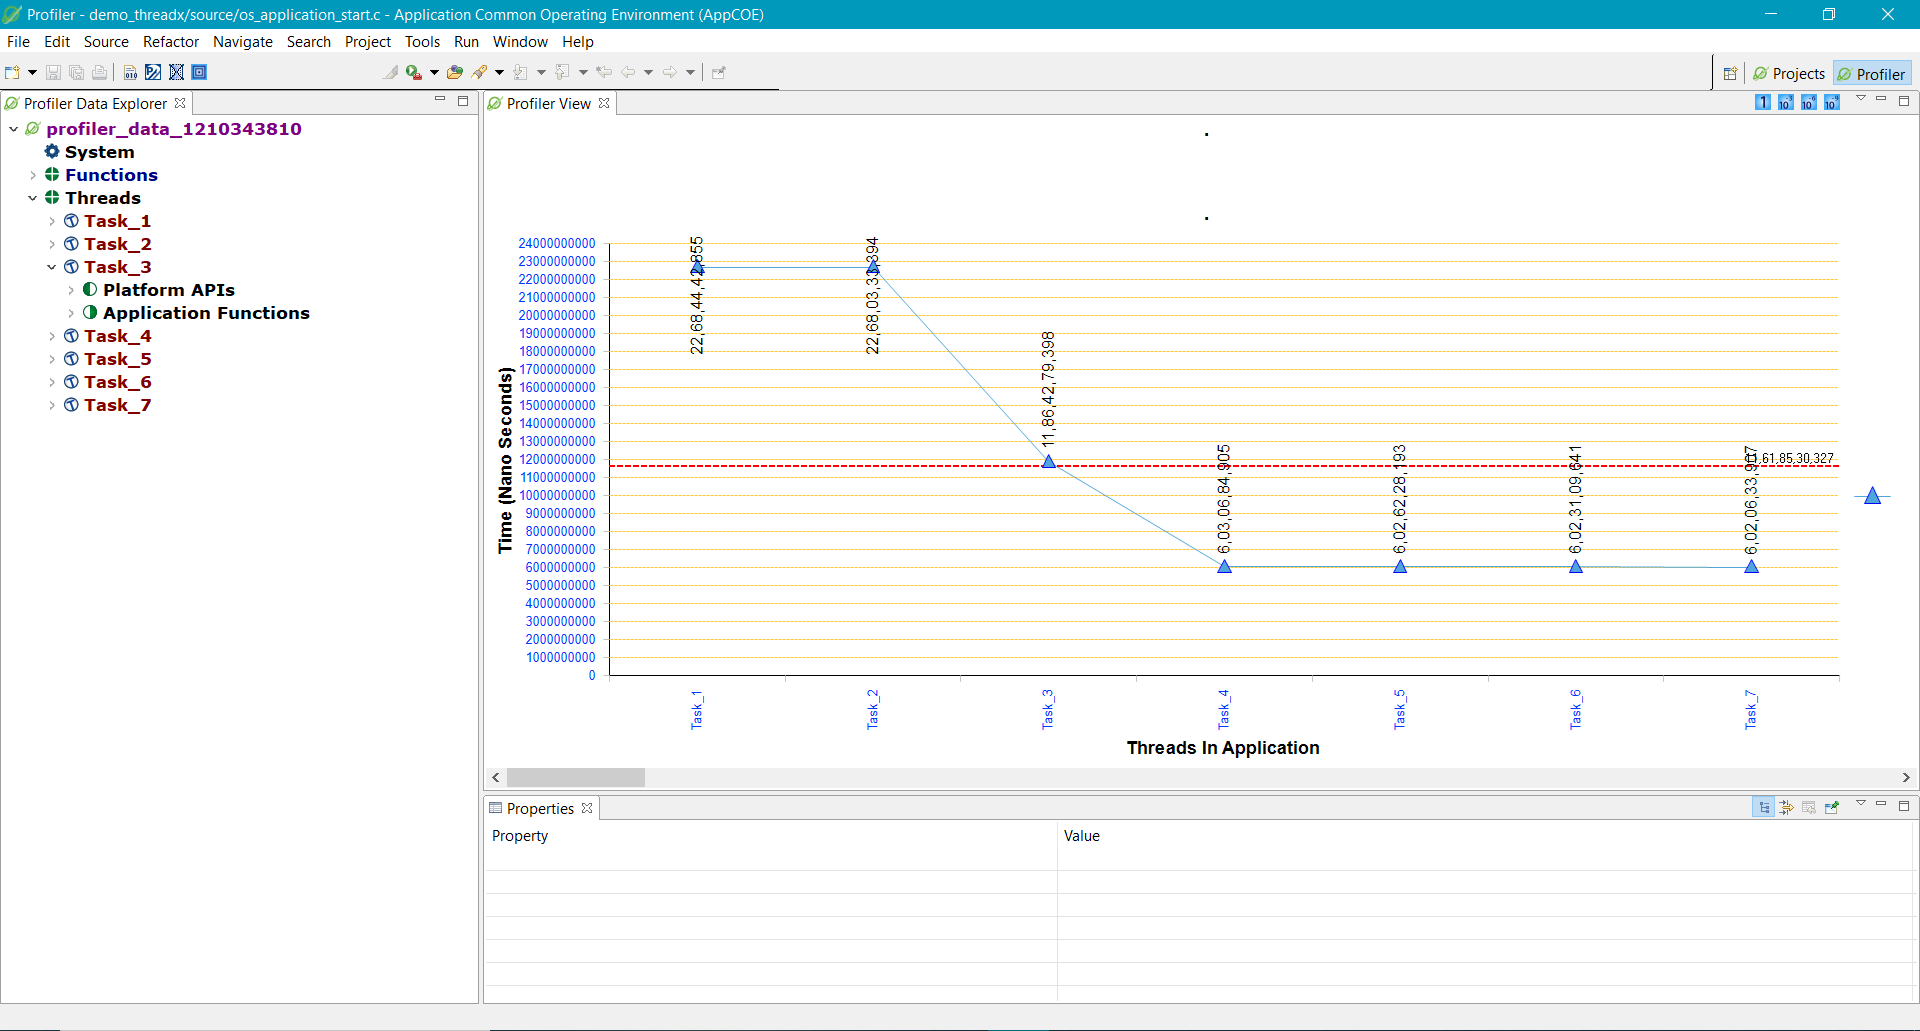
If you expand the Task tab, you have the following as already discussed under the Functions tab:
- Platform APIs
- Application Functions
Figure 7: Application-OS Profiler– Threads
Viewing Application-OS Profiler Data:
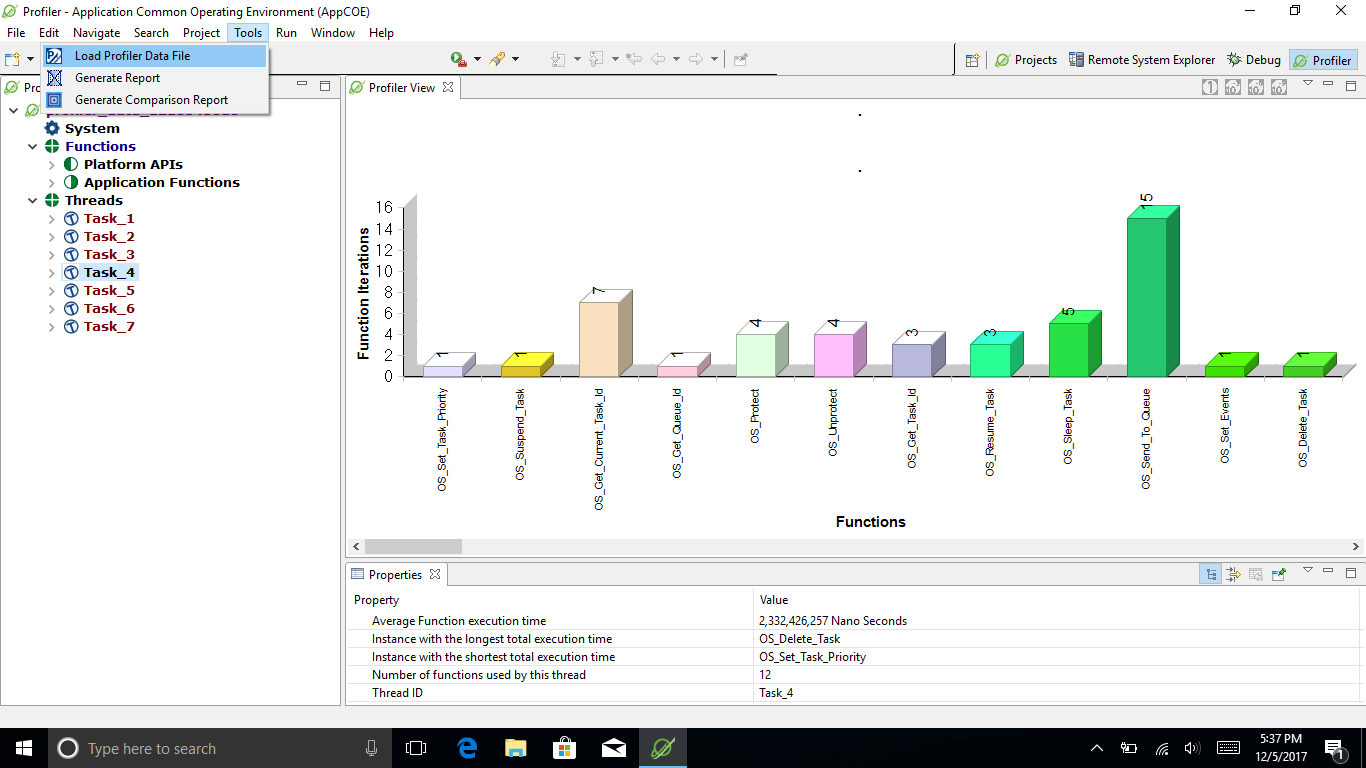
- Open the Application-OS Profiler perspective.
- From the AppCOE main menu, select Tools >Load Profiler Data File as shown in Figure 8.
Figure 8: Application-OS Profiler – Load Profiler Data
NOTE: This feature requires a license. Click https://mapusoft.com/downloads to request an evaluation license.
Start A Free 30 Day Product Trial
Explore Products
AppCOE
OS Changer
Automated Code Changer
Supported OS and Hardware types
Try or Buy
Trial Software
Contact Sales
Installation Help
Get Support
Support Portal
FAQ
Technical Data
Company
Career
News Room
Contact Us
Customers
Partners
